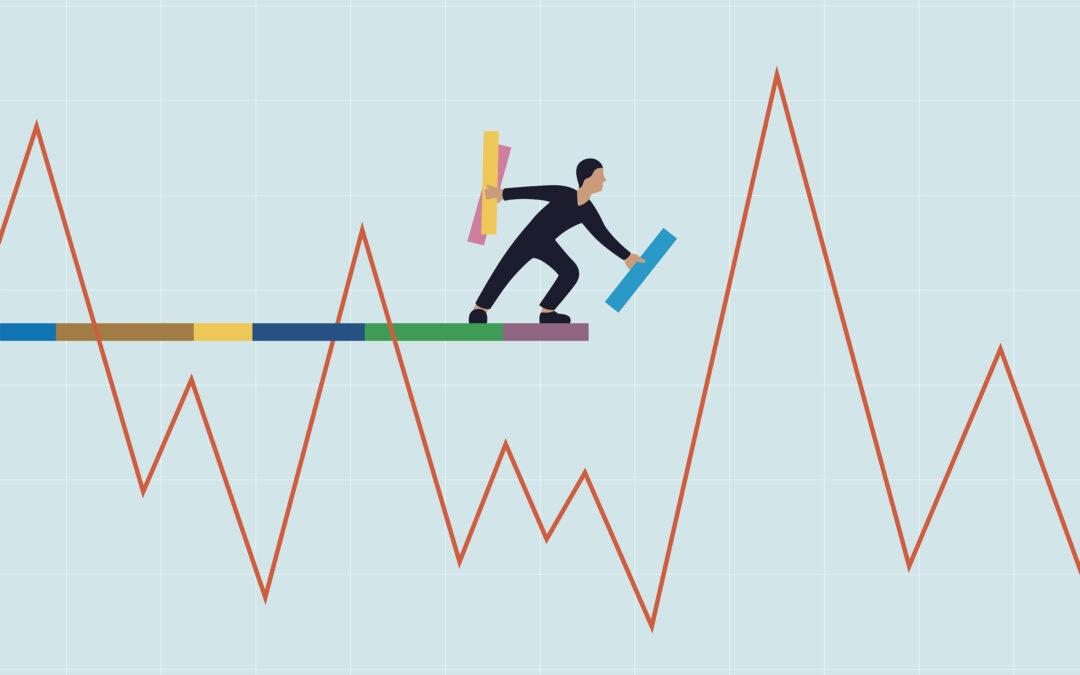
The magnitude and regularity of price changes is known as volatility. It gauges how erratically they swing and how frequently they rise or fall.
Volatility is a statistical measure of the spread of a security’s or market index’s returns. The higher the volatility, in most cases, the riskier the security. The standard deviation or variance of returns from the same security or market index frequently measures volatility.
It is defined statistically as the standard deviation of a market’s or security’s annualized returns over a given period – essentially, the rate at which its price rises or falls. High volatility occurs when prices fluctuate rapidly, hitting new highs and lows. Low volatility occurs when the price moves up or down slowly or remains relatively stable.
Historical volatility is calculated using different past market prices, whereas implied volatility is calculated using the market price of a market-traded derivative, such as an option.
Volatility in the securities markets is frequently associated with large swings in either direction. For example, a “volatile” market is one in which the stock market rises and falls by more than 1% over a sustained period. The volatility of an asset is an essential consideration when pricing options contracts.
Volatility is frequently used to describe the degree of uncertainty or risk associated with the magnitude of changes in the value of a security. Higher volatility indicates that the value of a security can potentially be spread out over a wider range of values. This means that the security’s price can change dramatically in either direction quickly. Lower volatility indicates that the value of a security does not fluctuate dramatically and is more stable.
What Is the Definition of Market Volatility?
The standard deviation of price changes over time is used to calculate market volatility. A standard deviation is a statistical concept that shows how far something deviates from an average value. Standard deviations are helpful because they not only tell you how much a deal can change but also provide a framework for the likelihood that it will happen. Values will be within one standard deviation of the average 68% of the time, 95% of the time they will be within two, and 99.7% of the time they will be within three.
Volatility represents the size of an asset’s price swings around the mean price; it is a statistical measure of its return dispersion. It can be measured using various methods, including beta coefficients, option pricing models, and standard deviations of returns.
Volatile assets are often riskier than less volatile ones because their prices are less predictable. Volatility is an essential factor in determining option prices.
Causes of Volatility
1.Factors of politics and economics
When governments make trade agreements, legislation, and policy decisions, they significantly impact the economy. Everything from speeches to elections can cause investors to react, influencing share prices.
Economic data is also essential because investors tend to respond positively when the economy is doing well. Monthly job reports can influence market performance, inflation data, consumer spending figures, and quarterly GDP calculations. If these fall short of market expectations, markets may become more volatile.
2.Season and weather
The first factor is seasonality. For example, when people want to get away from the snow in the winter, resort hotel room prices rise. They fall in the summer when vacationers are content to stay close to home. That is an example of demand and price volatility caused by regular seasonal changes.
Weather is another factor that influences price volatility. Agricultural prices, for example, are affected by supply. That is dependent on the weather being favorable for abundant crops.
3.Industry factors
Specific events can cause volatility within an industry or sector. For example, a significant weather event in an important oil-producing area can cause oil prices to rise. As a result, the share price of oil distribution-related companies may increase as they are expected to benefit, while those with high oil costs may see their prices fall.
What Is the Normal Level of Market Volatility?
Markets frequently experience periods of increased volatility. As an investor, you should expect about 15% volatility in average returns over a given year.
You should expect the market to fall about 30% once every five years. If you can’t handle that kind of volatility, you shouldn’t be an equity investor because it’s about average.
The stock market is mostly relatively calm, with brief periods of above-average market volatility. Stock prices aren’t constantly bouncing around—there are extended periods with little excitement, followed by short periods with significant moves up or down. These events cause average volatility to be higher than it would be on most days.
When investors are prepared for periods of volatility from the start of their investing journey, they are less likely to be surprised by them and more likely to react rationally.
Investors can prepare themselves and stay focused on their long-term investment goals by adopting a mindset that accepts volatility as a natural part of investing.
Recent Comments